Diplomacy
Autor:
trollgeir
Last Updated:
hace 12 años
License:
Creative Commons CC BY 4.0
Resumen:
test

\begin
Discover why over 25 million people worldwide trust Overleaf with their work.

\begin
Discover why over 25 million people worldwide trust Overleaf with their work.
\documentclass[a4paper]{article} % a4paper option recommended
\usepackage[english]{babel}
\usepackage{uureport}
\usepackage{cite}
\usepackage{hyperref}
\usepackage{amsmath}
\usepackage{graphicx}
\usepackage{pgfplots}


\bibliographystyle{alpha}

\title{Diplomacy}
\type{Report}
\course{Games \& Agents}

\author{A. Berland, B. Reigersberg, E. Koens, \\J. de Groot, K. van Katwijk, T. de Goey}

\begin{document}

supIntolerance = $S$ 0.0005\\
supFavor = $\sigma$ \\
time = $t$ \\
Trust = $T$ \\
Decay = $D$ = 1.1 \\
Paranoia = $P$ \\
incTrust = $\tau$ = 0.002\\


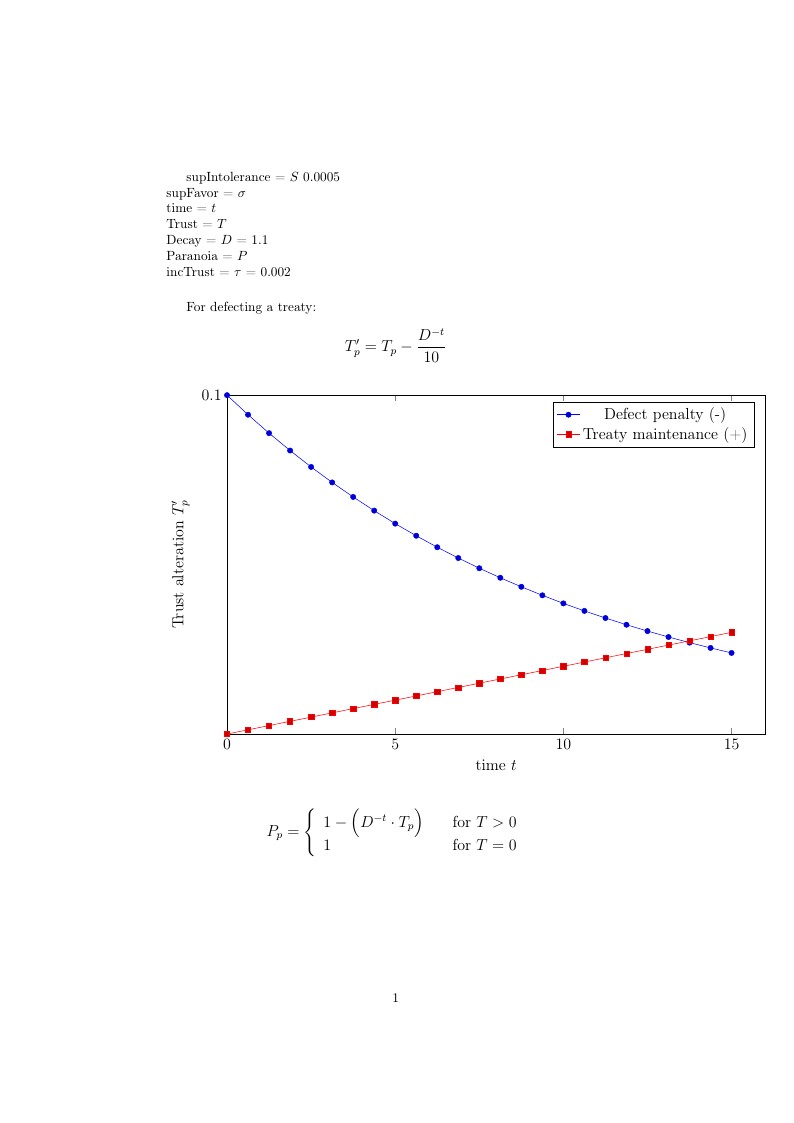
For defecting a treaty:
\large
$$ T'_p = T_p - \frac{D^{-t}} {10} $$

\center
\begin{tikzpicture}
  \begin{axis}[
  	width = 450,
    height = 300,
    xlabel= time $t$,
    ylabel={Trust alteration $T'_p$},
    xtick = {0,5,10,15},
    ytick = {0.1},
    xmin = 0,
    ymin = 0,
    xmax = 16,
    ymax = 0.1,
    domain = 0:15
  ]
    \addplot {(1.1^(-x)/10};
    \addplot {0.002*x};
    \legend{Defect penalty (-), Treaty maintenance (+)};
  \end{axis}
\end{tikzpicture}


\large
  \[ P_p = \left\{
  \begin{array}{l l}
    1 - \Big( D^{-t} \cdot T_p \Big) & \quad \text{for $T > 0$} \\
 	1 & \quad \text{for $T = 0$}

  \end{array} \right.\]
  \\

\center
\begin{tikzpicture}
  \begin{axis}[
  	width = 450,
    height = 300,
    xlabel= time $t$,
    ylabel={Paranoia $P_p$},
    xtick = {0,5,10,15},
    ytick = {1},
    xmin = 0,
    ymin = 0,
    xmax = 16,
    ymax = 1,
    domain = 0:15
  ]
    \addplot {1-((1.1^(-x))*(0.5))};

  \end{axis}
\end{tikzpicture}


\large
  \[ T'_p = T_p + \left\{
  \begin{array}{l l}
    (S \cdot \sigma)^2 & \quad \text{if $\sigma > 0$ \& ACCEPT}\\
    -(S \cdot \sigma)^2 & \quad \text{if $\sigma < 0$ \& REJECT}\\
    \text{0} & \quad \text{if ($\sigma \le 0$ \& ACCEPT) or ($\sigma \geq 0$) \& REJECT)}

  \end{array} \right.\]
  \\

\centering
\begin{tikzpicture}
  \begin{axis}[
  	width = 450,
    height = 300,
  	axis x line = middle,
    axis y line = middle,
    xlabel= supFavor $\sigma$,
    ylabel={Trust alteration $T'$},
    xtick = {-15,-10,-5,0,5,10,15},
    ytick = {-0.1,0,0.1},
    xmin = -15,
    ymin = -0.1,
    xmax = 15,
    ymax = 0.1,
    domain = -15:15
  ]
    \addplot [blue] [line width=2pt] {(x/abs(x))*((0.0005*x^2)};
  \end{axis}
\end{tikzpicture}

\end{document}